Giving engineers, scientists and architects the ability to see the objects they're making in 3D brings amazing benefits. Computer aided design might be more down-to-earth than a Pixar film, but it's no less magical.
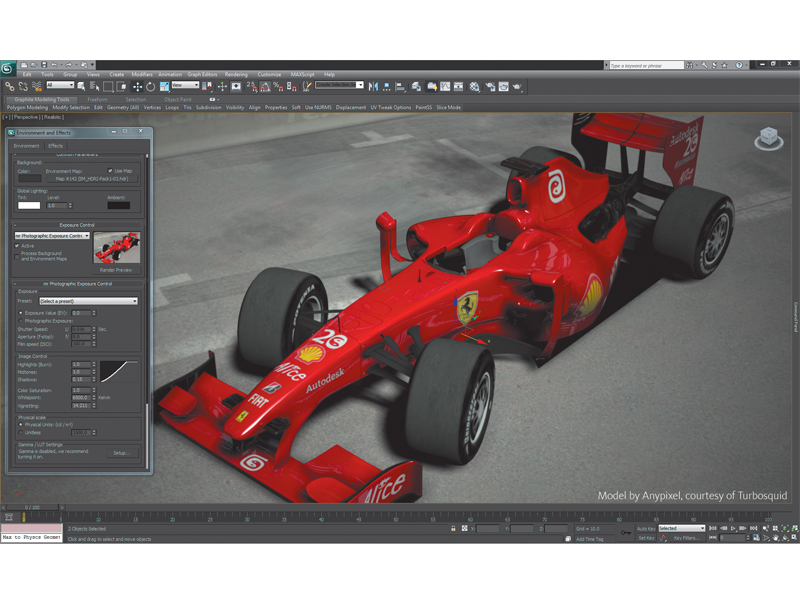
We spoke to John Hutchinson, Senior Rendering Architect at Autodesk, to find out why. We started by asking just how realistic artificial 3D environments can become. John contrasts Autodesk's approach of physically-based rendering with the needs of games and films.
"In [our] approach, we limit ourselves to algorithms and scene descriptions that are consistent with the physical behaviour of light," he explained. "This is a stark contrast to games and film, where realism is but one of many results desired from the rendering system. In physically-based rendering, we embrace the limitations of strict reality and our task becomes the accurate simulation of light transport. This way, we can create images that are very realistic."
What are CAD manufacturers doing to produce ever more realistic looking models? John explains that there are several initiatives at Autodesk. "Project Neon is a pilot offering that gives designers access to massively parallel, physically correct rendering in the cloud," he says.
"This allows designers to offload compute-intensive rendering and simulation jobs to Autodesk-sponsored compute farms. Coupled with core services for design storage and collaboration, this offering promises to put extreme reality in the hands of every designer. Future versions will evolve from still images to real-time rendering with progressively refined images delivered as compressed video."
Historically, a major bottleneck to realistic rendering has been the authoring of material shaders. "For design visualisation, this amounted to countless hours of tweaking arcane parameters until a plausible result was achieved," John says. "In a physically correct renderer, this can potentially be eliminated by directly measuring the reflectance properties of the material of interest."
Reflectance is measured using an instrument called a spectrophotometer, and commercial devices can already capture these properties for some classes of materials. Future generations of devices will allow the capture of spatially varying materials, as well as materials with subsurface reflectance properties.
Get the best Black Friday deals direct to your inbox, plus news, reviews, and more.
Sign up to be the first to know about unmissable Black Friday deals on top tech, plus get all your favorite TechRadar content.
"We imagine a future where users will rarely be faced with authoring materials: their CAD products will be cloud-aware, with access to vast repositories of accurate visualisation data," John adds.
3D printing
When we talk about 3D printing, we don't mean holograms or anaglyphs - we're talking about solid objects. To find out where this tech is headed, we spoke to Ian Adkins, Chief Technical Officer of Bits From Bytes, which makes the RapMan 3.1 3D printer.
"The machine takes filament off a reel and pushes it through a heated chamber like a hot glue gun", Ian explains. "According to the x, y, z co-ordinates of the print file, the thread is applied layer by layer until the item is complete."
Will we ever have Star Trek-style replicators in our homes? "Of course", says Ian. "Not that they will look anything like they do now. The machines will be consumer-oriented and print materials beyond the plastics available today. Instead of buying a replacement part, you'll download the 3D file and make it for a fraction of the cost."
3D fractals
The two-dimensional Mandelbrot Set brought fractal geometry to the masses.
As a fractal, this astonishing figure has no end of detail - however much you zoom into it, you see ever more detail despite the shape being based on a simple mathematical process. Every time you magnify it you see similar spirals, swirls, lakes and starbursts, but you'll never come across exactly the same thing twice.
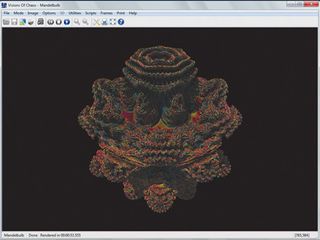
After years of searching, a 3D fractal has been found that has all the appeal of the original 2D Mandelbrot Set. Called the Mandelbulb, it exhibits fractal detail in all three dimensions and has been likened to various objects, including the unusual Romanesco variety of broccoli (also known as Roman cauliflower) and extra-terrestrial landscapes.

To see it for yourself, take a look at our step-by-step guide below. We'll show you how to explore the Mandelbulb using Visions of Chaos. You don't need any knowledge of maths to use it, and you can download a trial version from http://softology.com.au/voc.htm.
3D visualisation
While we develop ever more ways of gathering data, the workload faced by scientists also grows. Without some way of visualising the mountains of data we can now produce, important patterns could remain hidden, and this is where 3D visualisation comes to the fore.
Oil exploration is notorious for producing vast volumes of data. We spoke to Jonathan Henderson, Managing Director of ffA - a company that develops 3D seismic image analysis software for the oil and gas industries. He told us how 3D visualisation has been used in the Argyll field to find the proverbial needle in a haystack.
As the first oil field to come online in the North Sea, the Argyll field was abandoned several years ago as uneconomical. Some experts now think that modern technology could make it viable again, but before any company would consider going to the vast expense of drilling wells, it would be necessary to confirm that there truly are untapped reserves down there.
With this in mind, a seismic survey covering an area of 400km2 to a depth of 3-4km below the seabed was used to examine the geology of the area. This exercise generated huge volumes of data - tens of gigabytes - yet interpreting seismic data remains a task that relies heavily on expert knowledge.
Poring over two-dimensional visualisations would have been a thankless task, and a largely ineffective one at that, but with 3D visualisation it becomes possible to see the data in its proper context.
Oil is found trapped within porous rock, so the job of finding potential reserves in the Argyll field involved detecting pockets of such rock, known as sandstone intervals.
"3D visualisation allows geologists to isolate parts of the seismic signal that they think might represent sandstone and display it so that they can judge that what they are seeing is geologically feasible", Jonathan explains.
This might involve, for example, seeing the possible sandstone pockets draped on something called a horizon, which is a surface representing a particular geological age that can be thought of as the seabed as it was several million years ago. According to Jonathan, this visualisation helps geologists judge whether the features were deposited at the same time - a further indicator that there may be oil-bearing strata in the area.
Striking oil
In the 3D visualisation, two planes of raw seismic data are shown in the background and the coloured areas are possible sandstone. Colour coding is used to indicate which pockets are interconnected - an important factor to consider when deciding if any oil could be in sufficient quantities to make it an economically viable reservoir.
To cut a long story short, the outcome was that this area has "significant potential" for exploitation in the future. Of course the acid test will come only when an oil company puts up the cash to sink a well but 3D visualisation has proved itself by coming to a favourable conclusion where doing the same by invasive prospecting techniques would have cost a small fortune.
How to make your 3D own fractals
1. Start the Choas

Start Visions of Chaos, then select 'Hypercomplex fractals | 'Mandelbulb' from the Mode menu. Select 'Generate' from the Image menu.
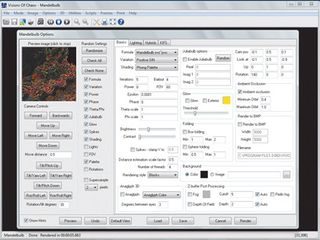
The 'Mandelbulb options' dialog box will appear, but for now you can just accept all the default values and click 'Render' to get your first glimpse of the entire Mandelbulb.
2. Open the Mandelbulb

Access the 'Mandelbulb Options' dialog box (click 'Image | Generate' again to access it), and use the camera controls at the top-right to zoom and pan around the Mandelbulb. The preview will update automatically each time you click on the controls. When you're happy with the preview, click 'Render' to see a high resolution image.
3. Explore the Mandelbulb

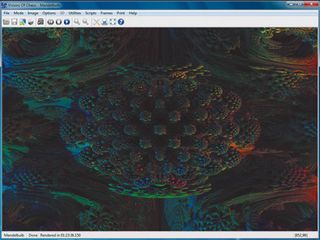
Finding exciting parts of the Mandelbulb this way could be time consuming - starting with one of the canned images is much quicker.
Open the 'Mandelbulb options' dialog box, click 'Load' and then select a Mandelbulb Parameter file with a name that starts 'mandelbulb sin power 8'. You can now zoom and pan to find interesting areas.
-------------------------------------------------------------------------------------------------------
First published in PC Plus Issue 310. Read PC Plus on PC, Mac and iPad
Liked this? Then check out 3D processors, memory and storage explained
Sign up for the free weekly TechRadar newsletter
Get tech news delivered straight to your inbox. Register for the free TechRadar newsletter and stay on top of the week's biggest stories and product releases. Sign up at http://anngonsaigon.site/register
Most Popular

